WebGIS, Visualization & Interactive Maps


We support you!
Consulting & conception
We deal with your tasks and issues and help you to find and specify the right solutions. If we reach our own limits, we have access to a broad network of experts to support us in finding solutions.Data analysis and pre-processing
We help you to view and understand relevant data and prepare and make it available for appropriate IT solutions.Design
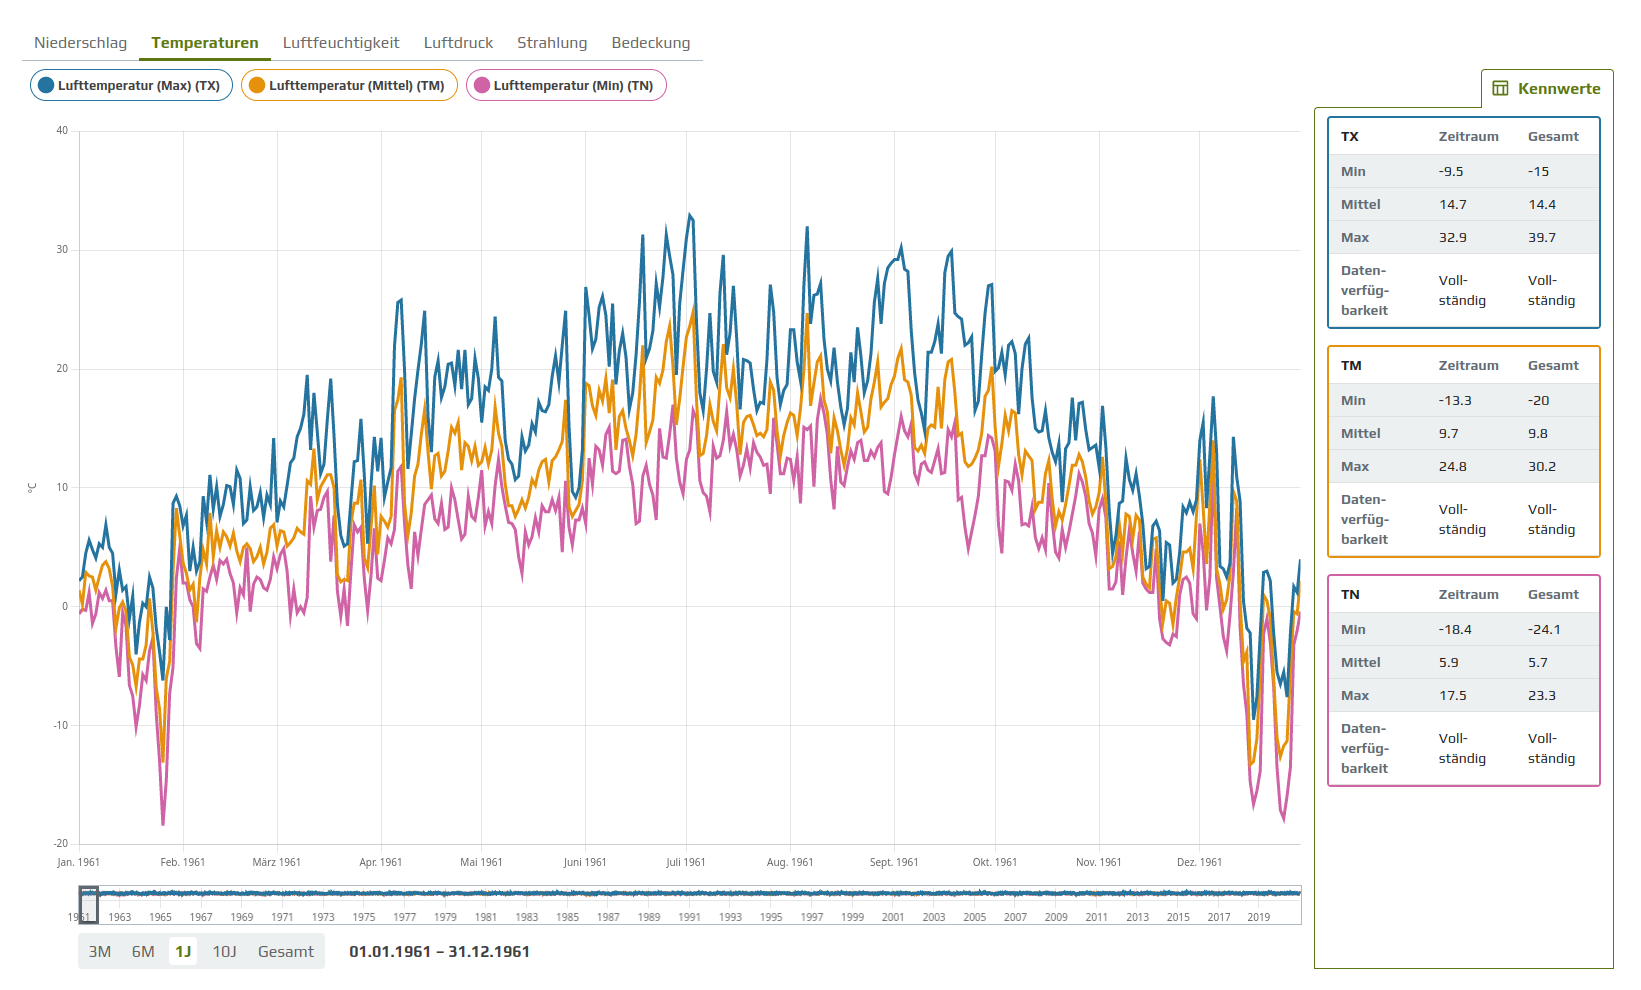
Our designers know how to present data in a user-friendly, visually appealing and responsive way in maps, diagrams or interactive visualizations. We use the latest technologies and involve you in a transparent design process at an early stage.Development, testing and integration
We implement customized solutions in modern and robust software. We rely on continuous delivery and are happy to support you in implementing the solution in your data center.Hosting & support
If required, we can also take over the hosting of your applications and web services in the cloud and organize 3rd level support.Technology
As an independent service provider, we master and support a wide range of commercial GIS products and open source GIS. With our extensive experience, we support our customers in the selection of suitable basic technologies and implement modern WebGIS solutions with functions for data visualization and data research.
In addition, we use modern technologies and standards that facilitate the handling of huge amounts of data, enable high-performance and fast web applications and make data visualizations particularly appealing and interactive.
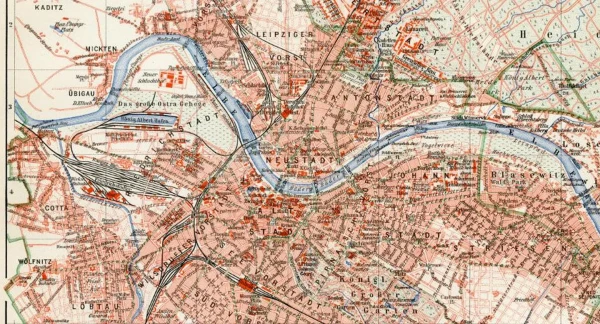
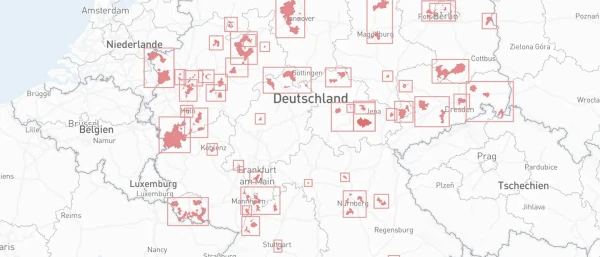
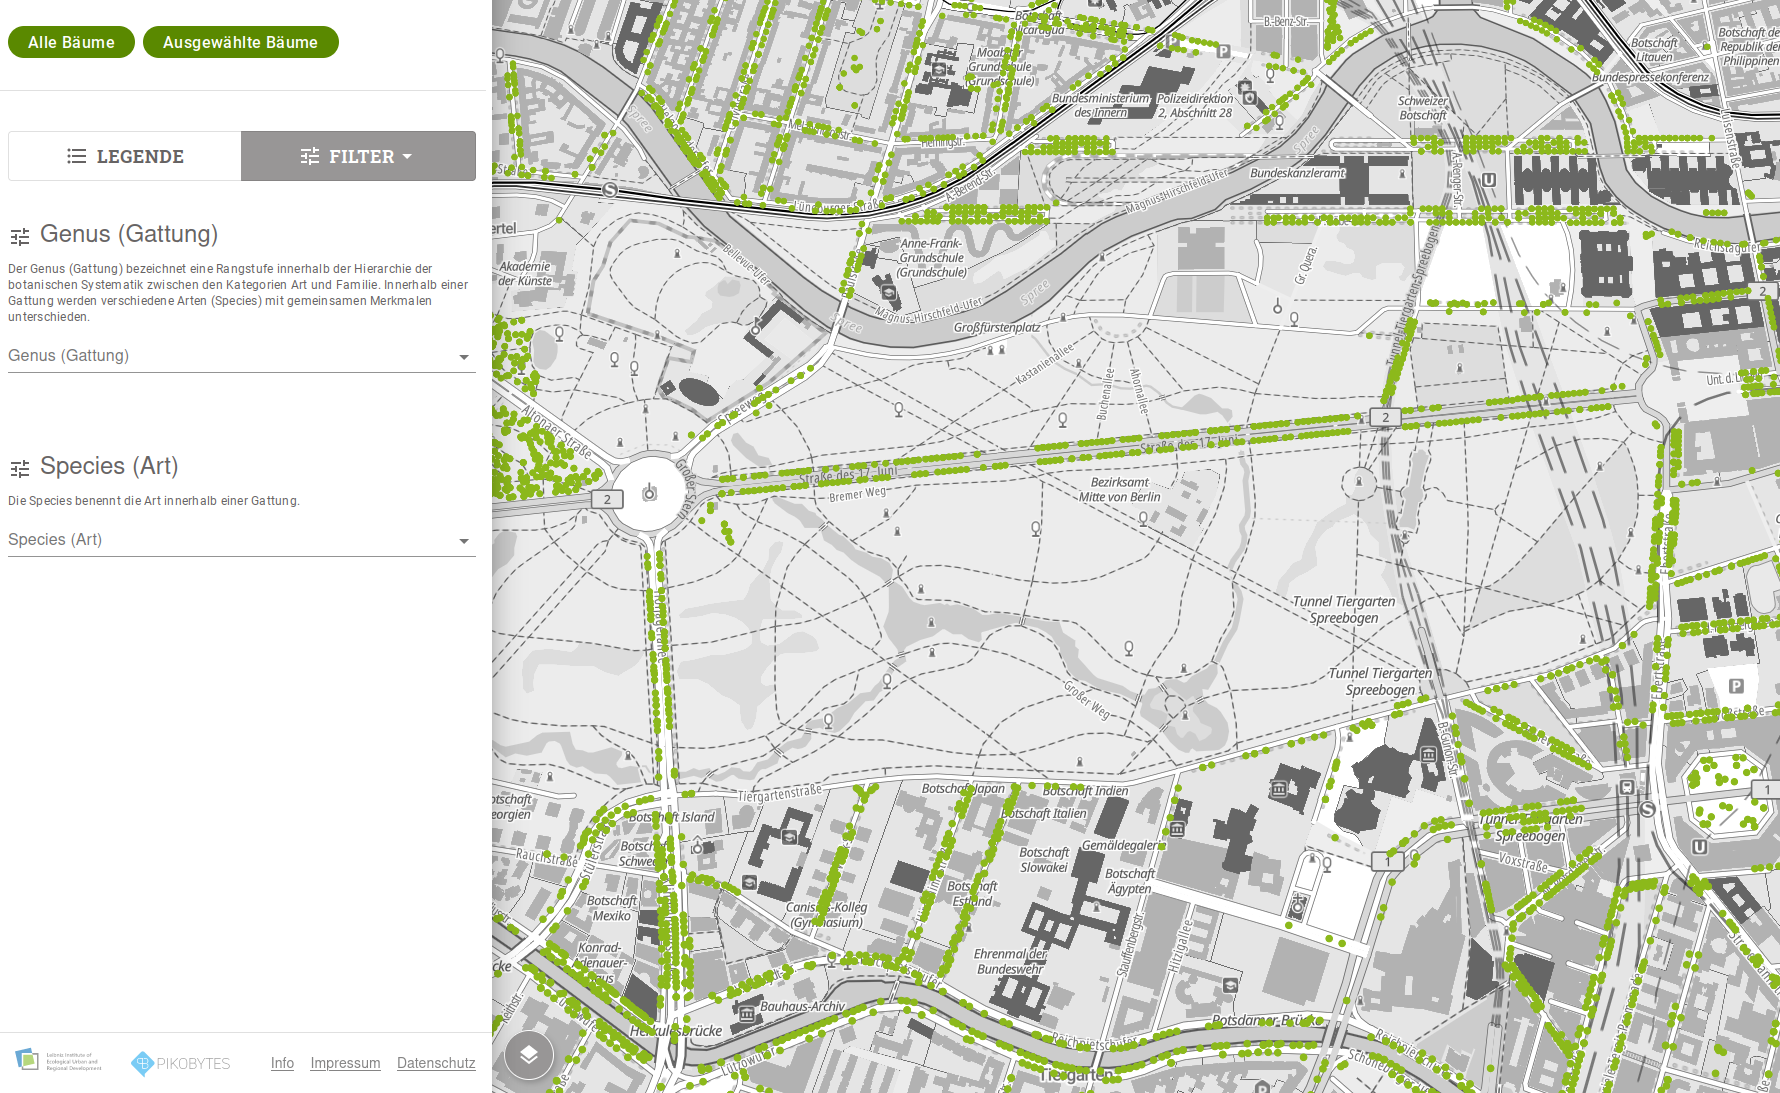
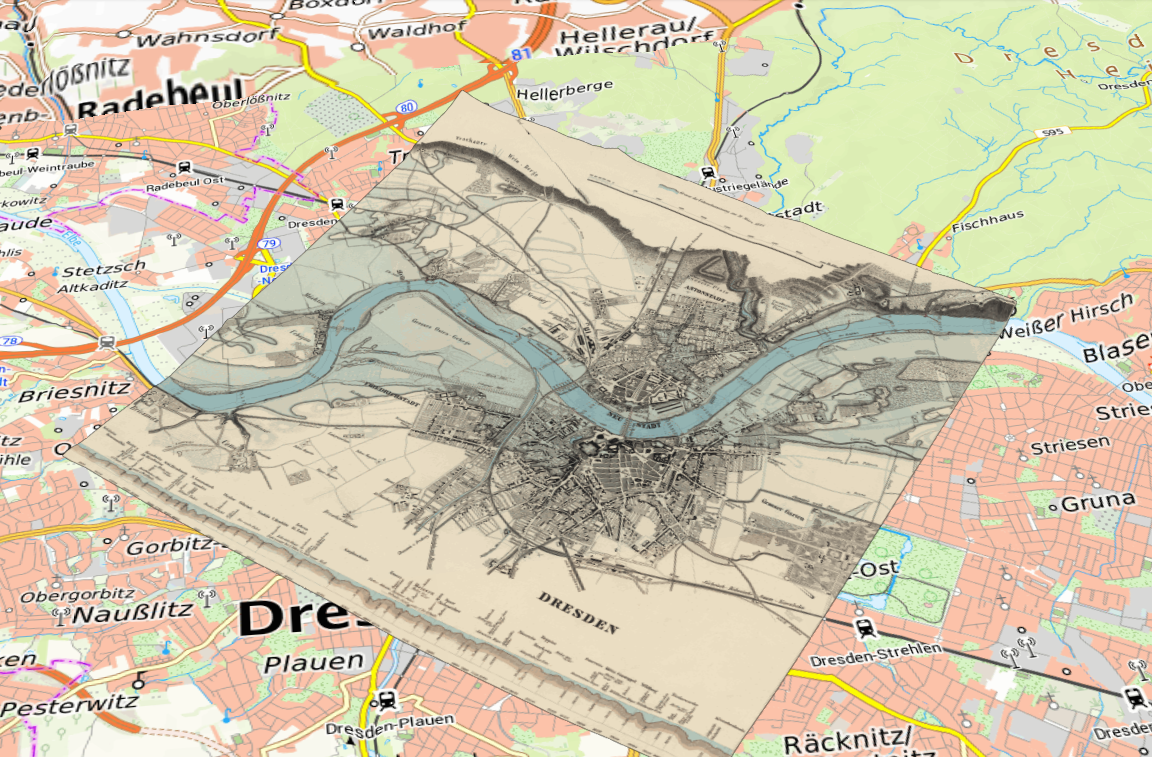
Sample projects
Here are some examples where we have turned our expertise in WebGIS and visualization into an indispensable tool, making customers' lives easier.